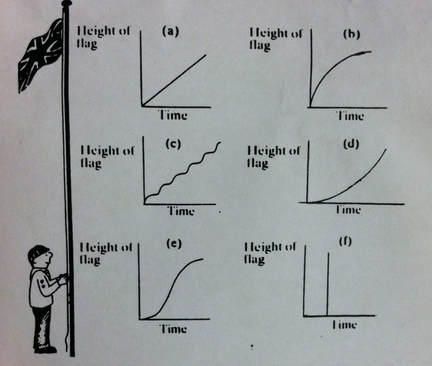
 Each graph below seems indicate to the height of the flag in relation to the time it is taking to raise the flag. Graph A means that the time in relation to height was linear. Graph B means that as the flag went up further it took more time. Graph C means that the boy stopped after each pull. Graph D means it started off slow and then sped up. Graph E means it started off super slow and then got easier as it got higher. Graph F means it went straight up right away. I think Graph A would be most accurate because as time goes by and you're pulling the flag goes up at a constant rate. Graph F is pretty much impossible because it just went straight up out of no where or that it was already up? Just appeared up there? That one is not possible really.
0 Comments
Leave a Reply. |
AuthorWrite something about yourself. No need to be fancy, just an overview. Archives
November 2017
Categories |
 RSS Feed
